
Why Container Loading is the Hidden Cost Center
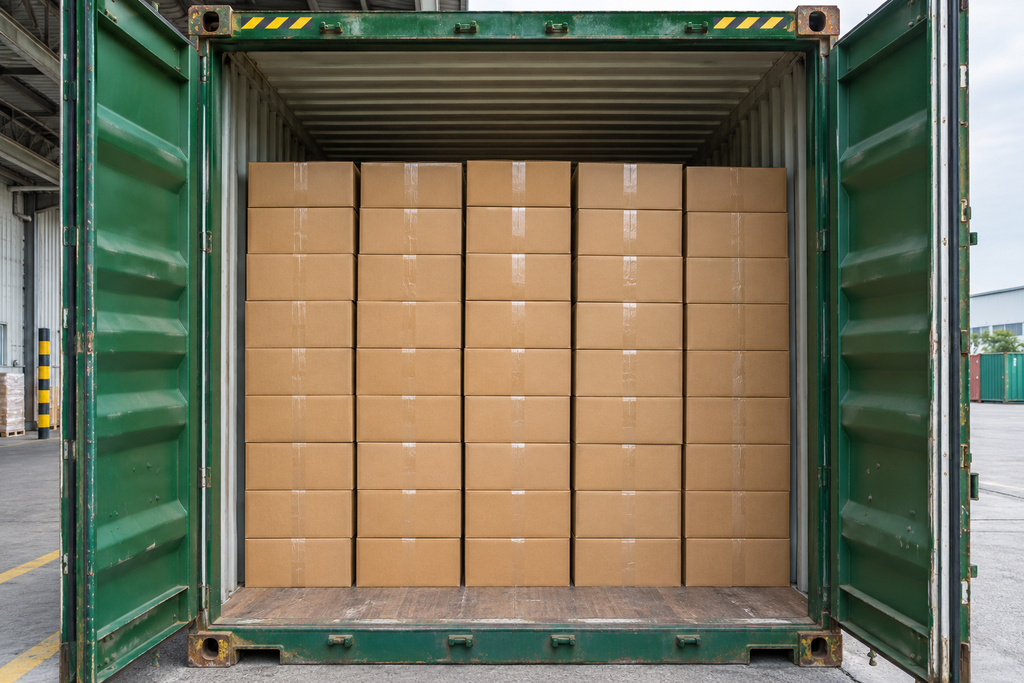
Every millimeter inside a shipping container costs money. When packaging isn’t designed with logistics in mind, brands lose thousands of dollars per shipment – not to mention higher CO₂ emissions from under-filled containers.
Container loading optimization bridges the gap between packaging design, logistics planning, and sustainability. It’s how the world’s most efficient supply chains turn space into profit.
At GreenDot Packaging, our engineers and logistics experts help brands maximize cube utilization, validate load stability, and design packaging that performs from factory floor to retail shelf.
Understanding the Economics of Container Loading
Freight costs are often calculated by the number of containers shipped, not necessarily their weight. A 40’ HQ container costs roughly the same to ship whether it’s full or half empty.
Optimizing loading can yield:
- 10–25% freight cost savings through higher cube efficiency
- 30–50% lower damage rates from improved stability
- Up to 20% CO₂ reduction by shipping fewer containers
The Three Loss Factors in Container Loading
| Loss Type | Description | Example | Fix |
|---|---|---|---|
| Dimensional Waste | Unused cubic space due to poor carton sizing | 10 cm headspace on each pallet layer | Redesign master carton height |
| Structural Waste | Load shifting or collapsing | Single-wall boxes in bottom row fail under compression | Upgrade to double-wall |
| Process Waste | Manual loading errors or inconsistent patterns | Mixed SKUs create voids | Use digital load plan & pallet map |
2. The Three Dimensions of Optimization
Cube Utilization
Cube utilization = (Product Volume ÷ Container Volume) × 100
Most exporters operate between 75–85% utilization, but 90%+ is achievable with structural packaging optimization.
Techniques:
- Use modular carton footprints (e.g., 600×400 mm) that tessellate across pallets and containers
- Align carton aspect ratios to standard pallet dimensions (48×40″, 1200×1000 mm, etc.)
- Evaluate stack height compatibility — a 5 mm height tweak can yield an extra pallet layer
- Model loads digitally with Cape Pack, TOPS Pro, or SolidWorks Motion
Pro Tip: Design master cartons so that each tier forms a rigid “brick pattern.” Interlocking reduces movement and distributes pressure evenly.
Weight Distribution
Uneven weight causes instability, overloading, and even container tipping during road transport.
Best Practices:
- Keep center of gravity near container midpoint
- Distribute heavy items on the bottom and middle rows
- Follow the 40-40-20 rule: 40% of total load weight in the front, 40% mid, 20% rear
- Verify total floor weight doesn’t exceed container flooring load rating (≈ 5.5–6 tons for 20’ GP)
Load Stability
Transit forces (vibration, impact, roll, pitch) can compromise packaging integrity.
Engineering parameters:
- Compression strength (BCT): must exceed cumulative top-load weight × safety factor (1.5–2×).
- Friction coefficient (μ): target ≥ 0.4 between pallet base and container floor for safe grip.
- Film containment force: 40–70 lbs at pallet mid-height for typical consumer goods.
Mitigation Tools:
- Edge protectors and slip sheets
- Honeycomb or corrugated inserts
- Anti-slip paper layers
- Stretch film with consistent pre-stretch (250–300%)
3. Designing Packaging for Container Efficiency
Your packaging design directly dictates how efficiently containers are loaded.
A “beautiful box” that wastes space or crushes easily can cost more in freight and returns than its aesthetic value adds.

Design Levers:
- Carton Dimensions: Standardize SKUs around modular footprints.
- Material Selection: Switch from single-wall to E/B-flute hybrid for strength without bulk.
- Orientation Optimization: Rotate products or change tray orientation to fit additional rows.
- Nesting & Collapsibility: Flat-pack where possible — especially for seasonal displays.
- Re-engineer Master Cartons: Test alternate RSC, FOL, or wrap-around designs.
Example: A personal-care brand increased units per container from 24,000 to 28,800 by resizing cartons and redesigning inner partitions, cutting freight cost by $180,000 annually.
4. Pallet Configuration: The Foundation of Container Loading
Container optimization begins with the pallet.
Key decisions:
- Pallet size: Match export standards (U.S. 48×40”, EU 1200×800 mm, Asia 1100×1100 mm).
- Stacking pattern: Column vs. interlock — test both for strength vs. space efficiency.
- Load height: Keep under 100″ (2.54 m) for most high-cube containers to allow air circulation.
- Shrink & strap strategy: Combine stretch-film wrapping with top-band strapping for long hauls.
Typical container fit (40’ HQ):
- 20 pallets @ 48×40” (double stacked)
- or 21–22 EU pallets @ 1200×800 mm
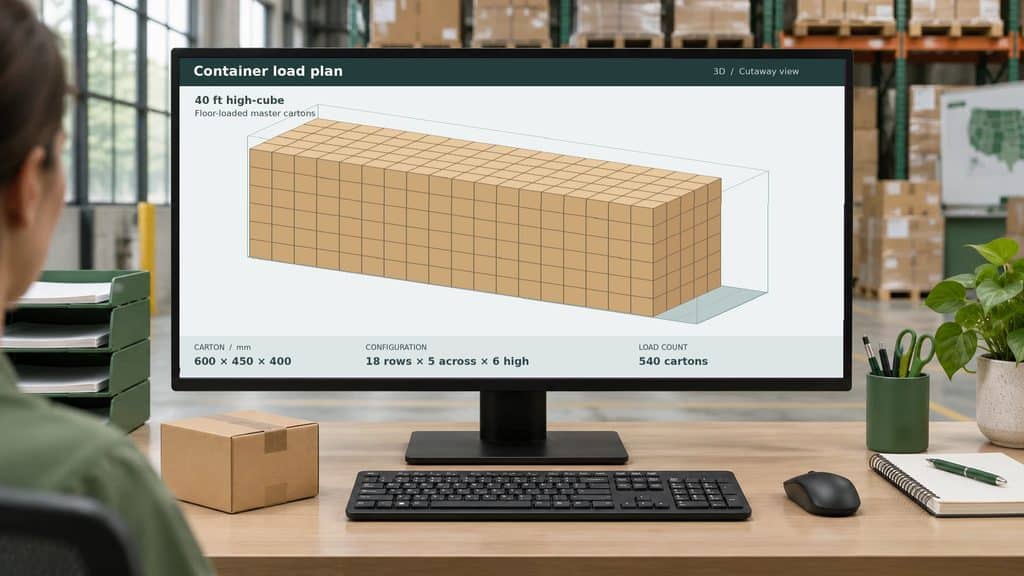
GreenDot’s packaging engineers use 3D load maps to verify pallet stability and ensure corner-to-corner fit before production.

5. Digital Load Planning and Simulation
Relying on manual layout planning can lead to inconsistent results.
Modern software provides visualization, automatic nesting, and center-of-gravity checks.
| Tool | Function | Ideal For |
|---|---|---|
| Cape Pack / TOPS Pro | Pallet + container nesting simulation | Consumer goods, FMCG |
| SolidWorks / ArtiosCAD | 3D structure + compression analysis | Industrial packaging |
| LoadPlanner / EasyCargo | Drag-and-drop container maps | SMEs and shippers |
| ISTA Testing | Real-world transit validation | Packaging qualification |
GreenDot’s in-house ISTA 1A-6A testing replicates transport shocks, vibration, and compression — verifying that optimized loads remain secure across all transit conditions.
6. The Sustainability Payoff
Every container you eliminate represents a measurable emissions reduction.
- Average CO₂ per 40’ HQ: ≈ 2.5 t (door-to-door Asia → U.S.)
- A 15% increase in cube utilization can save 375 kg CO₂ per container
- Multiply that by 1,000 containers/year = 375 t CO₂ saved, equivalent to planting 6,000 trees
Sustainable Packaging Synergy:
- Lightweight corrugate = less weight, more product per container
- Fewer containers = fewer ship movements
- Right-sized packaging = reduced waste downstream
Container optimization is therefore a core pillar of GreenDot’s Circular Logistics Strategy—designing packaging that travels efficiently and returns maximum value per shipment.
7. Implementation Framework: The GreenDot 5-Step Approach
- Audit – Measure cube utilization, weight balance, and damage rates.
- Analyze – Model current vs. optimized layouts using digital tools.
- Redesign – Adjust packaging structure and materials.
- Validate – Test with ISTA protocols and trial shipments.
- Deploy – Train teams on consistent loading SOPs and update packaging specs.
8. Quick Reference Checklist
- Standardize master carton dimensions
- Optimize pallet pattern and height
- Verify weight distribution front-to-back
- Use load planning software for every SKU refresh
- Test compression & vibration performance
- Re-audit container efficiency annually
Conclusion
Container loading optimization is a powerful yet underused lever for cost savings, damage prevention, and sustainability.
It’s where packaging engineering meets logistics intelligence — and the results show up directly in your bottom line.
Work with GreenDot’s packaging engineers to analyze your current container efficiency and discover how smarter packaging design can save you thousands per shipment.